Completed
3D Visualization Graph
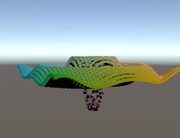
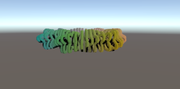
Interactive 3D mathematical visualizations built in Unity featuring wave functions, ripples, torus formations, and more.
Overview
Based on Catlike Coding's excellent Unity tutorials, with additional mathematical functions and visual experiments layered on top.
"The foundation comes from Jasper Flick's tutorials - I built on that base to explore additional wave patterns and visualization techniques."
Key Features
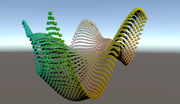
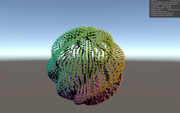
3D Function Graphs
Visualization using cube-based rendering
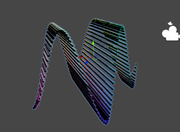
Real-Time Animation
Time-based transformations and dynamic updates
Dynamic Updates
Frame-by-frame position changes via Update function
3D Representation
Full Y-axis integration for true 3D visualization
Optimized Rendering
Planes instead of axes for cleaner visuals
Development Process
1.Instantiating cubes in 3D to represent function graphs
2.Time-based animation via Update function
3.Y-axis integration for true 3D representation
4.Refactored to use planes instead of individual axes
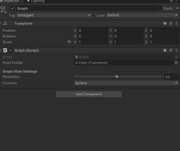
Technical Details
- • Unity, C#
- • Custom HLSL shaders
- • Mathematical functions: waves, ripples, torus formations
Tools Used
UnityC#HLSLShader Graph3D Math